Studio note · General
Product Comparison Chart: Fields, Structure and Example
Learn the fields, structure and categories of a product comparison chart, with a worked example and the cost rows buyers often miss.
- Updated
- November 17, 2026
- Reading
- 18 min
Implied comparisons appeared in 37% of sampled magazine advertisements in the 1950s, up from 22% in the 1930s, and the policy fight over naming a competitor only settled on August 13, 1979, when the U.S. Federal Trade Commission issued a definitive restatement of its comparative-advertising policy, according to historical research on U.S. comparative advertising.
Comparison is old. Evidence is newer. A product comparison chart earns its place when every row can be checked: a price with the day it was copied, a specification with its unit, a score with its weights and a source link beside each figure.
The chart that meets that standard does one job well. It puts recurring and conditional costs next to the sticker price, so a reader sees what the first year costs and what every year after it costs. Prices, fees and subscription terms move, which is why the record carries a date and a recheck schedule.
Table of Contents
- Core Fields Every Product Comparison Chart Needs
- What Buyers Need From a Comparison Chart
- How to Group Fields Into Categories
- Recording the Full Cost of Ownership
- Recording Specifications, Scores and Sources
- Worked Example of a Three-Product Chart
- Mistakes That Make a Chart Misleading
- Build and Check the Chart Before Publishing
Core Fields Every Product Comparison Chart Needs
A product comparison chart is a grid with one row per product or option and one column per field, and the same fields apply to every row. Twelve fields cover most buying decisions, whether the row is a kettle, a laptop or a software subscription.
| Field | What to record | Example entry | Why it matters |
|---|---|---|---|
| Product name and model | Exact model, tier or version | Coffee maker, model CM-240, 1.5 L carafe | Prevents mixing two releases |
| Seller and market | Where the price applies and the currency | Seller name, US, USD | Prices differ by market |
| Price date | Date the price was copied | 13 Nov 2026 | Prices change and go stale |
| Base price | Headline price before extras | 149.00 USD | Starting point for comparison |
| Mandatory extra costs | Fees that must be paid | 12.00 USD delivery | Shows the amount actually paid |
| Recurring cost | Monthly or annual charges | 9.99 USD per month on the 12-month plan | Captures ongoing spend |
| Key specification | One measurable attribute with its unit | Battery life: 10 hours | Gives a comparable basis |
| Warranty | Length and main conditions | 2 years limited | Shows the risk after purchase |
| Return policy | Return window and who pays return shipping | 30 days, buyer pays return shipping | Shows the cost of changing your mind |
| Score or rating | Score on a stated scale with criteria | 8.4/10, quality 40%, experience 25%, value 35% | Summarizes the comparison |
| Source link | Seller page or publisher used for the value | Seller product page URL | Lets readers verify each value |
| Notes or caveats | Limits and exclusions | Price excludes sales tax | Adds context to the row |
Why Each Field Earns Its Place
Identification comes first. The product name and model pin down the exact release, so a chart never prices last year's model against this year's. Seller and market record where the price applies and in which currency, because a US listing and a Canadian listing are two different rows even when the box is identical.
Price needs a date to become a record. The price date is the day the figure was copied from the seller page. Base price is the headline amount before extras, and mandatory extra costs such as delivery or a required activation fee show what the buyer pays at checkout.
The remaining fields do specific work:
- Recurring cost captures the monthly or annual charge, written with the plan size so two subscriptions can be compared fairly.
- Key specification states one measurable attribute with its unit, for example "Battery life: 10 hours", because a bare number can't be checked or compared.
- Warranty and return policy record length and conditions, including who pays return shipping.
- Score and source link let a reader verify the summary and see how it was built.
- Notes hold caveats such as "price excludes sales tax" or "delivery quoted for mainland addresses only".
Leave the Gap Visible
A field with no published value should read "not stated", followed by the date it was checked. Deleting the cell hides a gap the buyer needs to see, and leaving it blank looks like an editing oversight.
Rule for gaps: a blank cell hides a question. "Not stated, checked 13 Nov 2026" shows the reader exactly what the seller hasn't published.
Fill each row from the seller's own page, not from a search result snippet or a marketplace summary. The seller page is the one a reader can open to check the figure for themselves.
What Buyers Need From a Comparison Chart
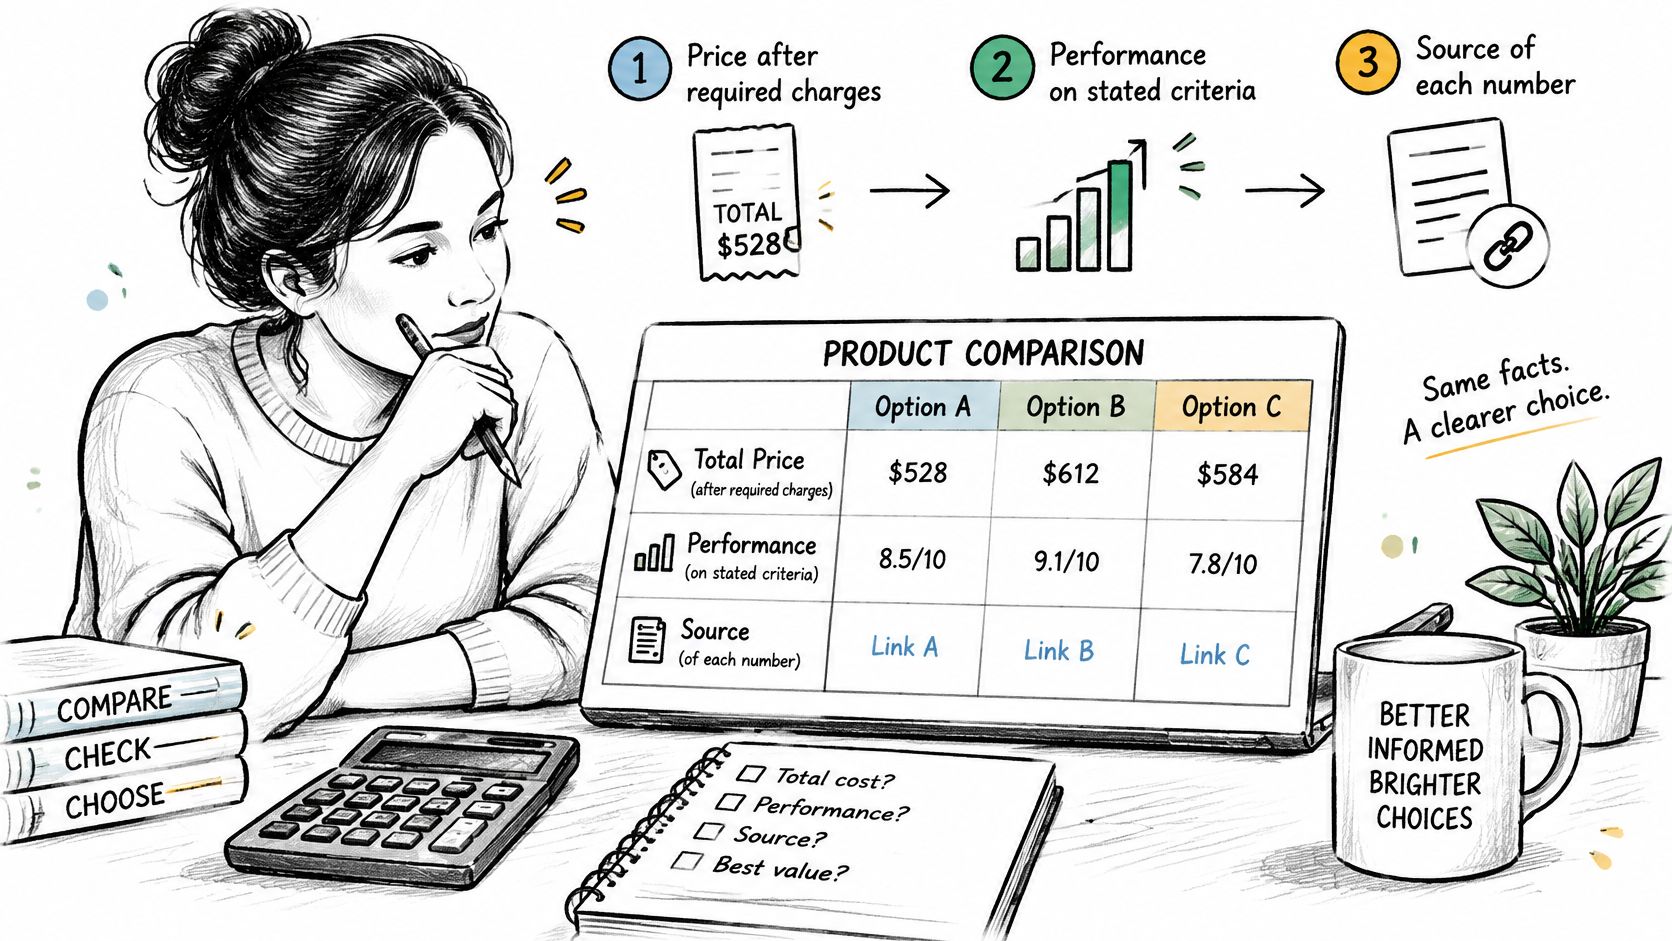
Buyers ask three questions in order, and the columns should answer them in that order. What does it cost after every required charge? How does it perform on the stated criteria? Where did each number come from?
A chart decides the purchase, and the layout decides whether the chart gets read.
Comparing before buying is settled behavior. In a 2016 Pew Research Center survey, 79% of U.S. adults said they had made an online purchase, and 65% typically compared prices in physical stores with online prices and chose whichever was cheaper, according to the Pew Research Center's online shopping report. Nine years later, the habit holds: in 2025, 68% of respondents said they always or often compare prices when shopping online, according to Ipsos research on online shoppers.
A chart that ignores this reader wastes their time. One that serves them answers all three questions without forcing a hunt.
Comparison Happens Across Channels
Shoppers move between the aisle and the browser. Pew's survey found that nearly half of online shoppers had used a cellphone inside a physical store to look up reviews or search for better prices. A chart built for that reader has to survive being read on a phone, one column at a time, in a shop with poor signal.
Three things follow for anyone building the chart:
- Total cost before headline cost. A price column that stops at the sticker answers a question nobody asked. Recurring charges and conditional fees belong beside the sticker price, each with its date, so the gap between two rows reflects the actual cost difference.
- Performance stated on named criteria. "Runs quietly" is an opinion. "42 decibels at one metre, measured under the maker's published test method" is a comparison a reader can check.
- A visible trail. Every figure links to the page it came from, and the link sits on the figure itself, so a skeptical reader reaches the source in one tap instead of digging through a footer.
Work through the columns in the order the buyer asks the questions: cost first, performance second, provenance third. A finished chart works like a receipt. The total appears first, the line items justify it, and the seller's name stays attached so the buyer can go back and check. Keep the source link on screen beside the figure it backs, because a row the reader can verify is a row the reader can trust.
How to Group Fields Into Categories
Twelve fields read as a wall of columns unless they're grouped. Five groups, always in the same order, teach a reader where to look by the second row.
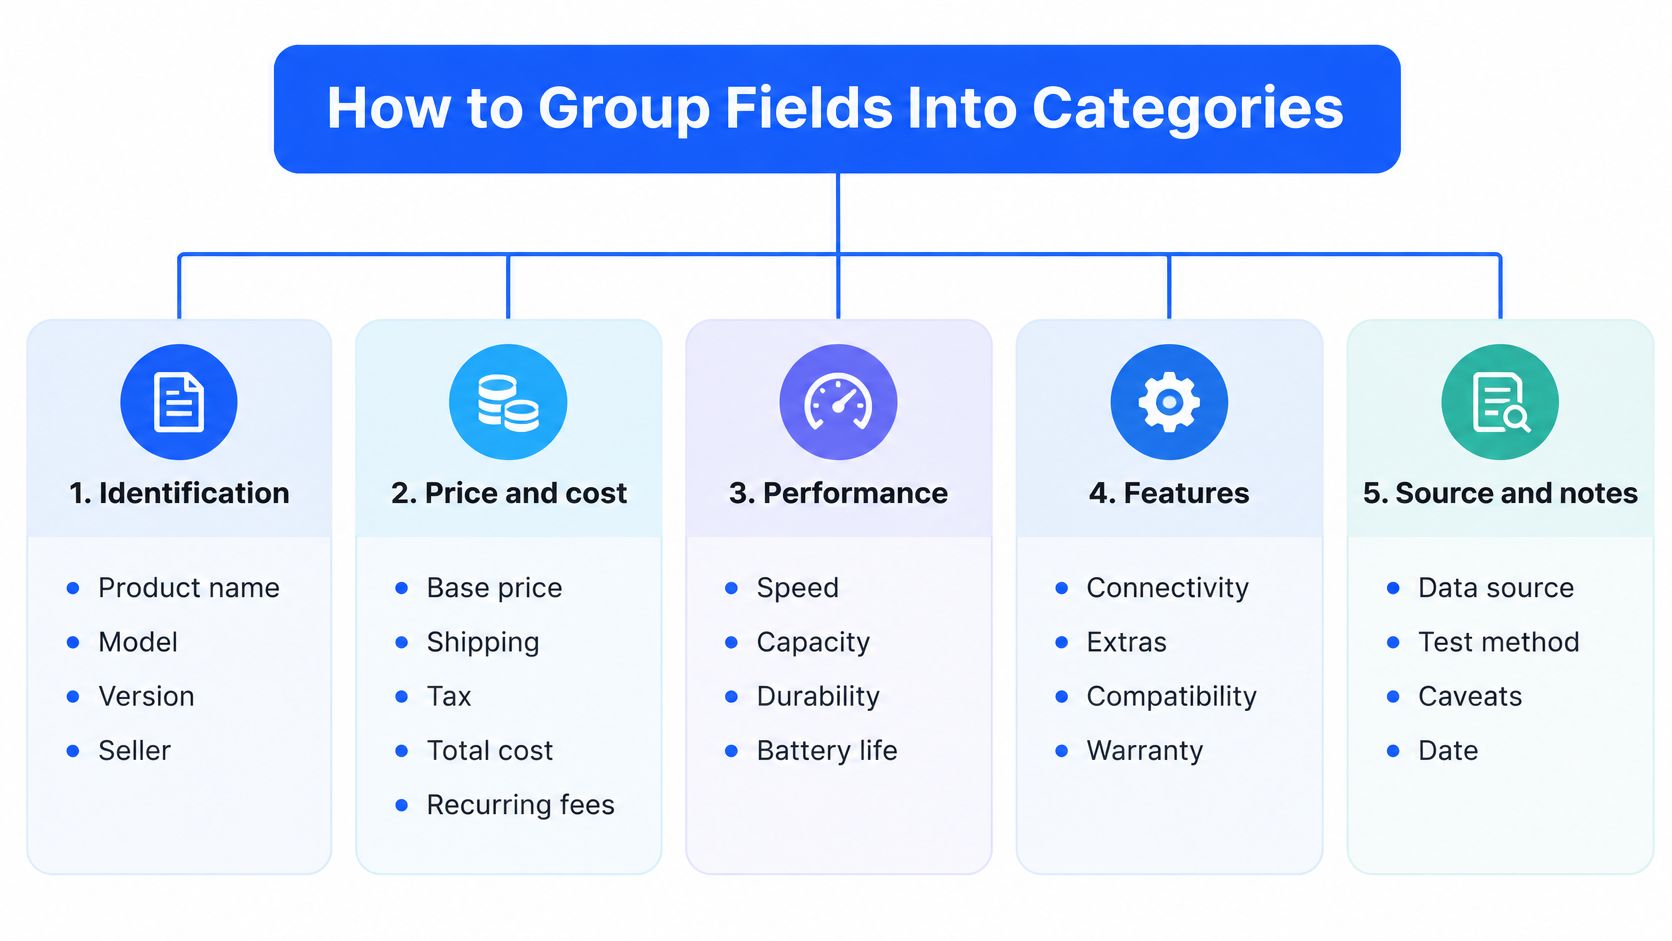
Group 1, identification. Product name, model, version and seller. This group tells the reader which row they're on and never changes once the row is set.
Group 2, price and cost. Base price, mandatory fees, recurring charges and the price date. Keep these adjacent, because a base price separated from its fees invites the reader to compare the wrong number.
Group 3, specifications. Measurable attributes with units, in a fixed order across every row. If battery life comes third for one product, it comes third for all of them.
Group 4, performance and experience. Warranty, returns, setup, delivery and ratings. These answer what happens after the money moves.
Group 5, evidence and notes. Source link, score, verification date and caveats. Placing evidence last looks tidy but weakens the chart, because a reader who never reaches the final column never sees the proof.
Stable Order Beats Clever Order
Sorting columns by importance for one product breaks the grid for every other product. Fix the column order once, then keep row labels to four or five words so the left edge scans cleanly. A reader who learns in the first row that the return window sits under "Returns" doesn't have to hunt for it in the third.
Structure for Accessibility, Not Just Looks
The chart is an information-architecture component, not a picture. W3C's web content accessibility guidance recommends genuine data tables rather than layout tables, column and row headers marked in semantic HTML, and header-to-cell relationships defined with scope attributes for simple tables or id and headers associations for multi-level headers.
Practical requirements follow from that:
- A caption that states the chart's scope, such as "three cordless vacuums compared on price, runtime and returns".
- Units inside the column labels, so "Battery life (hours)" replaces a bare "10".
- Text equivalents for icons, stars and color-coded ratings, because meaning that lives only in color disappears for some readers.
- A responsive reading order that still makes sense when columns stack on a narrow screen.
Accessibility check: read the chart aloud from top to bottom. If the product name and the criterion don't come before each value, a screen-reader user hears numbers with no address.
Recording the Full Cost of Ownership
A chart that shows only the purchase price flatters whichever option has the smallest sticker. The costs that decide the bill arrive later: subscriptions, consumables, delivery, installation, return fees, cancellation penalties and tax. Record each one as a line and tag it as one-time, recurring or conditional.
| Cost line | Type | How to record it | Example |
|---|---|---|---|
| Purchase price | One-time | Base price with the date it was quoted | 199.00 USD, 13 Nov 2026 |
| Shipping or delivery | One-time | Fee per order and the region it applies to | 12.00 USD per order, US addresses |
| Required installation or setup | One-time | Mandatory fee, or note that none is stated | None stated on the seller page |
| Consumables | Recurring | Replacement cost multiplied by uses per year | 40 USD per year |
| Subscription | Recurring | Monthly and annual price, with the plan size | 24 USD per year on the 12-month plan |
| Energy or running cost | Recurring | Rated consumption per year multiplied by the local tariff | 150 kWh per year at 0.30 USD per kWh, about 45 USD |
| Return fee | Conditional | Fee, return window and who pays return shipping | Free within 30 days, buyer pays return shipping |
| Cancellation penalty | Conditional | Fee and notice period | 1 month notice, no fee |
| Introductory price end | Conditional | Price before, date it ends and price after | 9.99 USD for 3 months, then 14.99 USD |
| Sales tax or VAT | Conditional | Rate and region where it applies | Not included in the listed price, shown at checkout |
Separate the first year from every year after. A first-year total adds the base price, mandatory one-time charges and twelve months of any subscription. The ongoing figure repeats only the recurring lines. The table's example product illustrates the gap: 199.00 USD plus 40 USD per year in consumables comes to 239 USD after one year and 319 USD after three, before shipping or tax enter the picture. Rank options on both totals, because the order often flips between year one and year three.
Why Post-Introductory Pricing Belongs in the Table
Subscription prices move, and the increase usually lands after the buyer has already committed. A chart that records the introductory rate and stops there hides the part of the bill the buyer will pay. Recording the offer price, the date it ends and the price that follows turns a marketing hook into a cost line the reader can plan around.
Mandatory charges have a legal benchmark too. The U.S. Federal Trade Commission's rule on unfair or deceptive fees took effect on May 12, 2025, for live-event tickets and short-term lodging, requiring businesses to disclose the total price upfront, including mandatory fees known and calculable at the time, according to the FTC's guidance on the junk fees rule. A consumer chart can apply the same discipline to any category: name the base charge, name each compulsory fee, then show what the final payment may include.
Plan size belongs next to every subscription price. Comredix quotes starting per-serving prices as the vendors' own lowest figures, which usually apply to the largest plan sizes, so a monthly number without its tier tells a reader very little. The same bundling logic applies to borrowing: how APR on student loans works shows a single rate that folds interest and fees together, which is what a first-year total does for a product.
Mark the Rows That Move
Add a volatility flag to any line where subscription limits, tariffs, shipping charges or return policies change often, and recheck those rows first. A higher upfront price can be the better value when its running costs are lower, its add-ons are optional and its pricing is predictable. The cheapest listed option is only the cheapest under one set of assumptions, and the chart should say which. Dating every quoted price keeps the record honest, because a figure that moved last quarter still shows exactly what it cost on the day it was checked.
Recording Specifications, Scores and Sources
Every value in a chart needs two attachments: a unit and a source. Compare two entries for the same row. "Weight: 1.2 kg, from the manufacturer's spec sheet dated 13 Nov 2026" can be checked by anyone in a minute. "Lightweight" cannot be checked at all, and it starts an argument instead of settling one.
The same rule applies to numbers that look complete on their own. A battery figure of "10" means nothing until the row says 10 hours, under the maker's stated test conditions, on a named page. Unit, condition, source: that is the minimum a spec cell should carry.
Scoring With the Weights on the Page
Comredix rates each entry from 0 to 10 on three criteria, and the order of the list follows the weighted total. Quality accounts for 40% of the score and is judged on the specifications, features, materials and terms the maker publishes. Experience accounts for 25% and covers setup, comfort, sizing, ordering, delivery and returns. Value accounts for 35% and measures what the quoted price buys compared with the rest of the field, and what it costs over time.
Print those weights beside the score rather than in a footnote three screens away. A reader who can see the split can disagree with the weighting and adjust their own reading, which is the point of showing the method at all.
A score row also needs its scale stated outright. "8.4" reads differently on a 0 to 10 scale than on a 0 to 5 scale, and the chart should never leave the reader guessing which one applies.
Comredix applies one published scoring method across its rankings, links every figure to its publisher, and copies prices from sellers' pages on the date shown. The assessments come from manufacturers' and sellers' documentation, including specifications, manuals, policies and price tables, and the pages say so rather than implying a product was tested by hand.
Provenance Is a Quality Control
Documented comparison is a recognized quality mechanism. The U.S. National Institute of Standards and Technology defines a key comparison as comparing results obtained through two or more different measurement approaches, and its NIST quality manual calls for documented information sources, data-integrity controls, uncertainty determinations and checks against independent methods. Applied to a consumer chart, that means judging every alternative against the same stated criteria and checking specifications against documentation rather than impressions.
The research world uses the same habit. The NIH's FAIR data principles call for clear usage licences, detailed provenance information and adherence to community data standards, so a figure can be checked and responsibly reused. A chart borrows that discipline every time it puts a link beside a number instead of asking the reader to trust it.
A score without its weights and its sources is a claim. A score with both is evidence.
Worked Example of a Three-Product Chart
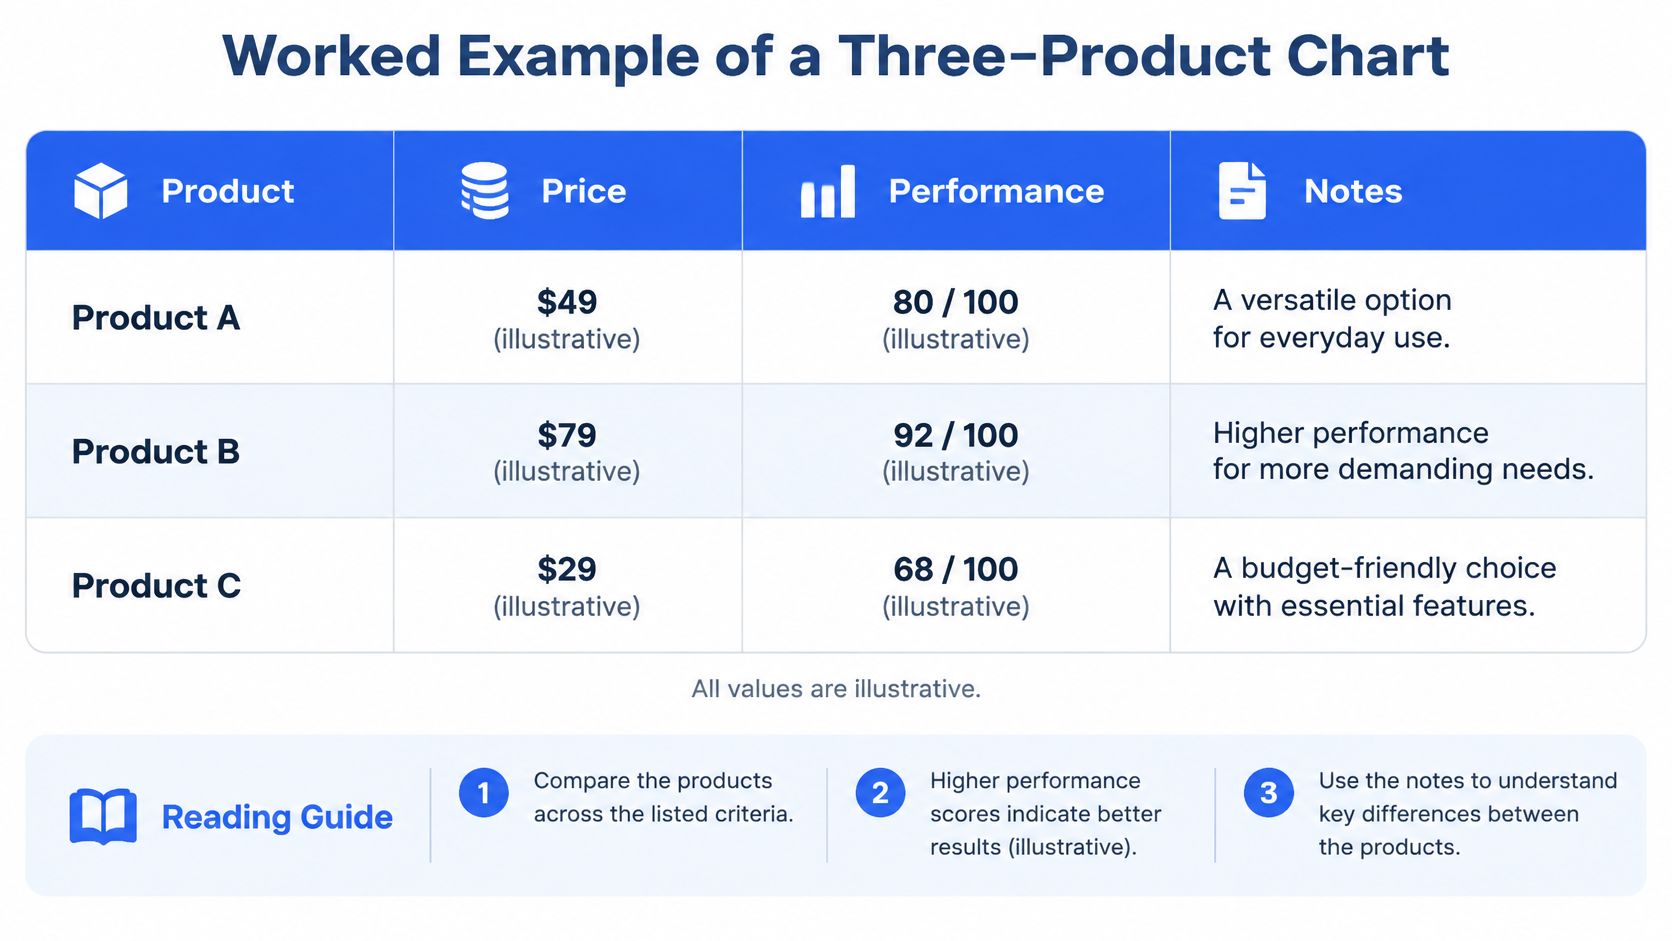
The table below compares three hypothetical products. Every value is illustrative and shows the format, not a real price or a test result.
| Field | Product A | Product B | Product C |
|---|---|---|---|
| Base price (USD) | 129.00 | 95.95 | 113.00 |
| Mandatory delivery (USD) | 0 | 10.00 | 0 |
| Subscription per year (USD) | 0 | 0 | 60.00 |
| First-year total (USD) | 129.00 | 105.95 | 173.00 |
| Battery life (hours) | 10 | 8 | 12 |
| Warranty | 1 year | 2 years | 2 years |
| Return window (days) | 30 | 14 | 30 |
| Price date | 13 Nov 2026 | 13 Nov 2026 | 13 Nov 2026 |
| Source | Seller product page | Seller product page | Seller product page |
| Notes | First-year total = base + delivery + 12 months subscription | Lowest base price, shortest return window | Highest first-year cost, longest battery life |
Reading the First-Year Total
Product A comes to 129.00 USD, which is the base price plus zero delivery plus no subscription. Product B comes to 105.95 USD, from 95.95 USD plus 10.00 USD delivery and no subscription. Product C reaches 173.00 USD once the 60.00 USD annual subscription is added to a 113.00 USD base.
Product B has the lowest base price and the lowest first-year total. It also has the shortest return window at 14 days and the lowest battery life at 8 hours. Product A and Product C both offer 30-day returns. Product C runs longest at 12 hours of battery life and costs the most in year one, entirely because of the subscription.
No Single Winner, Only Trade-offs
The chart names no winner because the right row depends on the buyer.
- A buyer who needs time to change their mind favours A or C, where the 30-day return window applies.
- A buyer focused on the lowest first-year outlay favours B, provided the 14-day return window and the shorter runtime are acceptable risks.
- A buyer who values runtime weighs C's 60.00 USD annual subscription against four extra hours of battery life.
A finished chart also shows how to read it, and the format scales to categories where terms matter as much as price. A best ecommerce platform for SEO comparison carries the same rows, because platform price, feature set and checkout friction together decide what running a store costs.
How to Read a Row
Scan across a row to compare products on one field, then down a column to see everything one product offers. Before acting on any value, check the price date and open the source link. A price copied three weeks ago may already be wrong, and the chart says so when the date is visible.
The notes row carries the arithmetic. Writing "first-year total = base + delivery + 12 months subscription" inside the table lets a reader recompute every cell without guessing what was included.
Mistakes That Make a Chart Misleading
The most damaging mistake is a headline price that leaves out mandatory fees, because the displayed winner isn't the cheapest to buy. The fix is a column, not a disclaimer: add the mandatory-cost line before any ranking appears, and let the total decide the order.
The other errors repeat in the same pattern, and each has a short fix:
- A "best" label with no criteria shown. Fix it by printing the weights beside the score, so the reader knows whether quality, experience or value drove the result.
- A former or reference price never offered to the public for a reasonable period. Fix it by removing the comparison or dating it precisely.
- Color-only ratings. Fix them with text labels, because a red badge reads as "avoid" only to people who can see it.
- A chart that is never rechecked. Fix it with a dated schedule for prices, subscription limits, warranties and availability.
Mixed versions, missing units and undated prices trace back to the same source: a field filled without a rule. Each one has a specific remedy in the field list, and none of them needs a redesign, only a check.
The Regulatory Benchmark
The U.S. Federal Trade Commission states that comparative advertising is informative when the bases of comparison are clearly identified, and that claims about performance, features, safety, price or effectiveness must be truthful and substantiated before publication, according to the FTC's advertising guidance for small business.
Price comparisons get particular scrutiny. A higher reference price must be factual rather than fictitious or misleading, and a claimed former price should reflect a bona fide price offered to the public for a reasonably substantial period. Comparative claims themselves only became widely accepted after the FTC rejected trade-association and media-clearance restrictions that had blocked them, which is why substantiation rather than assertion is the modern standard.
Recheck rule: write the date of every recheck into the chart. A correction nobody can date is indistinguishable from a claim nobody verified.
Keep an evidence field behind each specification, quoted price, score input and "best value" conclusion. When a figure moves, the field shows what changed and when, and the reader sees a corrected number rather than a swapped one.
Build and Check the Chart Before Publishing
Start with the format decision. Comparing three or more options on price and specifications calls for a full chart with the twelve core fields and the cost lines above. Comparing two options on one or two criteria calls for a pros and cons list, which is faster to read and just as honest. A feature matrix replaces the chart when prices aren't the question yet, and a price history table tracks one product over time instead of several at once.
Choosing the fields takes category knowledge, not a template. Two ecommerce platforms can match on subscription price and integrations while differing sharply at checkout, and Baymard's checkout usability research reports a 70.19% global average cart-abandonment rate, with 17% of U.S. online shoppers saying they abandoned an order in the previous quarter because the checkout process was too long or complicated. Checkout friction belongs in the table for that category, because it changes what the purchase costs in lost orders.
Four Steps From Blank Grid to Finished Chart
- Choose the products and name each row exactly. Write the model, tier or version, not the product family. "Software, Pro tier, annual billing" is a row. "Software" is a category.
- Fill one column per product from seller pages checked on the same day. Enter the price date as you go, so a single stale column can't hide among fresh ones.
- Check every value against its source link. Confirm each statistic reaches its original publisher rather than a summary of a summary, and confirm the units match across rows.
- Write the next recheck date into the chart. Give volatile rows, such as prices, subscription limits and return windows, a shorter interval than stable specifications.
If the finished table needs a shareable visual, a comparison of infographic makers covers the tools that turn rows into a graphic without losing the source links behind each value.
A chart is finished when a reader can verify it row by row. That means no cell without a source, no price without a date, and no score without its weights on display. The reader who checks one figure and finds it accurate will trust the other eleven.
Comredix publishes side-by-side comparisons that follow the rules above: documented features, seller prices with the date they were copied, one scoring method weighted the same way across every ranking, and a source link beside each figure. If a reader wants to see the format applied to a real category, from air purifiers to budgeting apps to store platforms, the Comredix rankings show every row with its evidence attached.
Spotted an error in this guide? Email editorial@comredix.com