Studio note · General
Average Overdraft Fee in 2026: Benchmarks and Real Costs
The average overdraft fee is about $27 to $35 per transaction. See sourced figures by bank, how fees are calculated and what they cost you.
- Updated
- November 18, 2026
- Reading
- 14 min
The average overdraft fee falls between $27 and $35 per transaction. The FDIC's supervisory study puts the median at $27, while the CFPB's study of five large institutions calculates $32.50 per fee-generating transaction. Each figure measures a charge per overdraft event, not an annual cost.
Banks collected $5.83 billion in combined overdraft and non-sufficient-funds fees in 2023, $6.13 billion less than the $11.96 billion reported for 2019, according to the CFPB's data spotlight on 2023 overdraft and NSF revenue. That decline shows fee revenue fell; it does not, by itself, establish how the number of charged transactions changed.
The per-item fee sets the cost of one overdraft. Annual cost also depends on how often a bank charges the fee, which can vary by bank, account type and household. The benchmarks below provide a starting point for calculating that yearly total.
Table of Contents
- Average Overdraft Fee at a Glance
- Why Published Averages Disagree
- Overdraft Fee Designs and What Each Costs
- Overdraft Terms Defined
- How to Calculate Your Annual Overdraft Cost
- Who Pays Overdraft Fees and How Often
- Your Rights Before You Opt In
- Lower-Cost Options Compared
- Check Your Overdraft Fee Before You Opt In
Average Overdraft Fee at a Glance
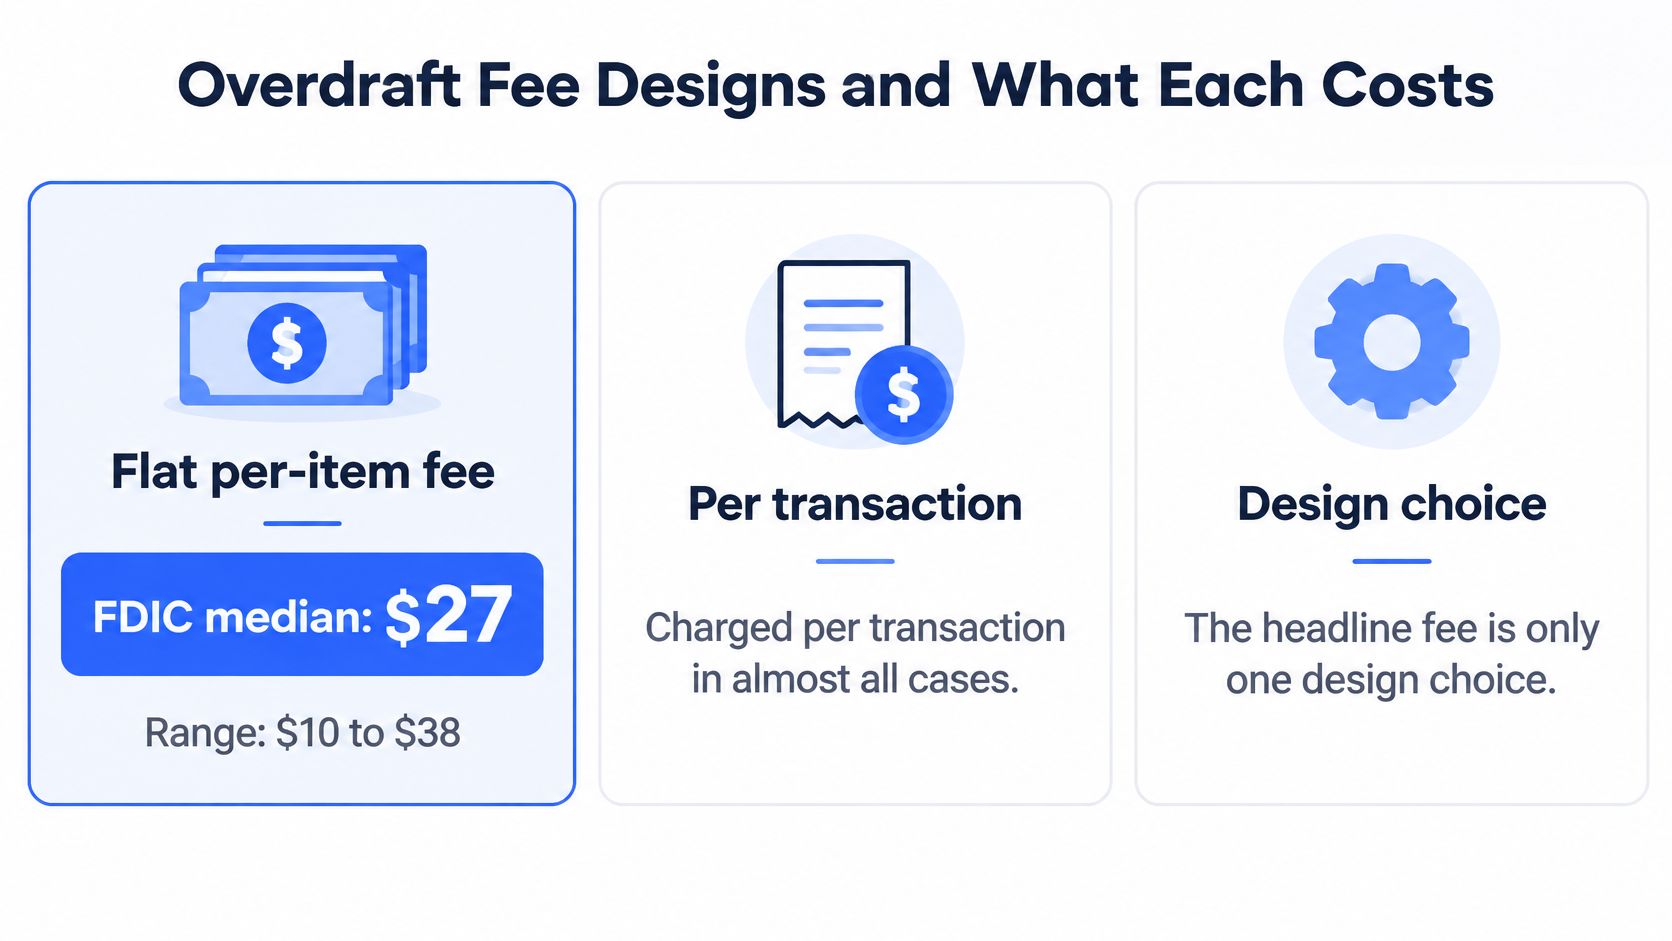
The FDIC's Study of Bank Overdraft Programs found that automated overdraft usage fees ranged from $10 to $38 per transaction, with a median of $27, and that the fee was assessed per transaction in almost all cases. Supervisory data of that kind is the strongest anchor available, because it comes from fee schedules rather than reader recall.
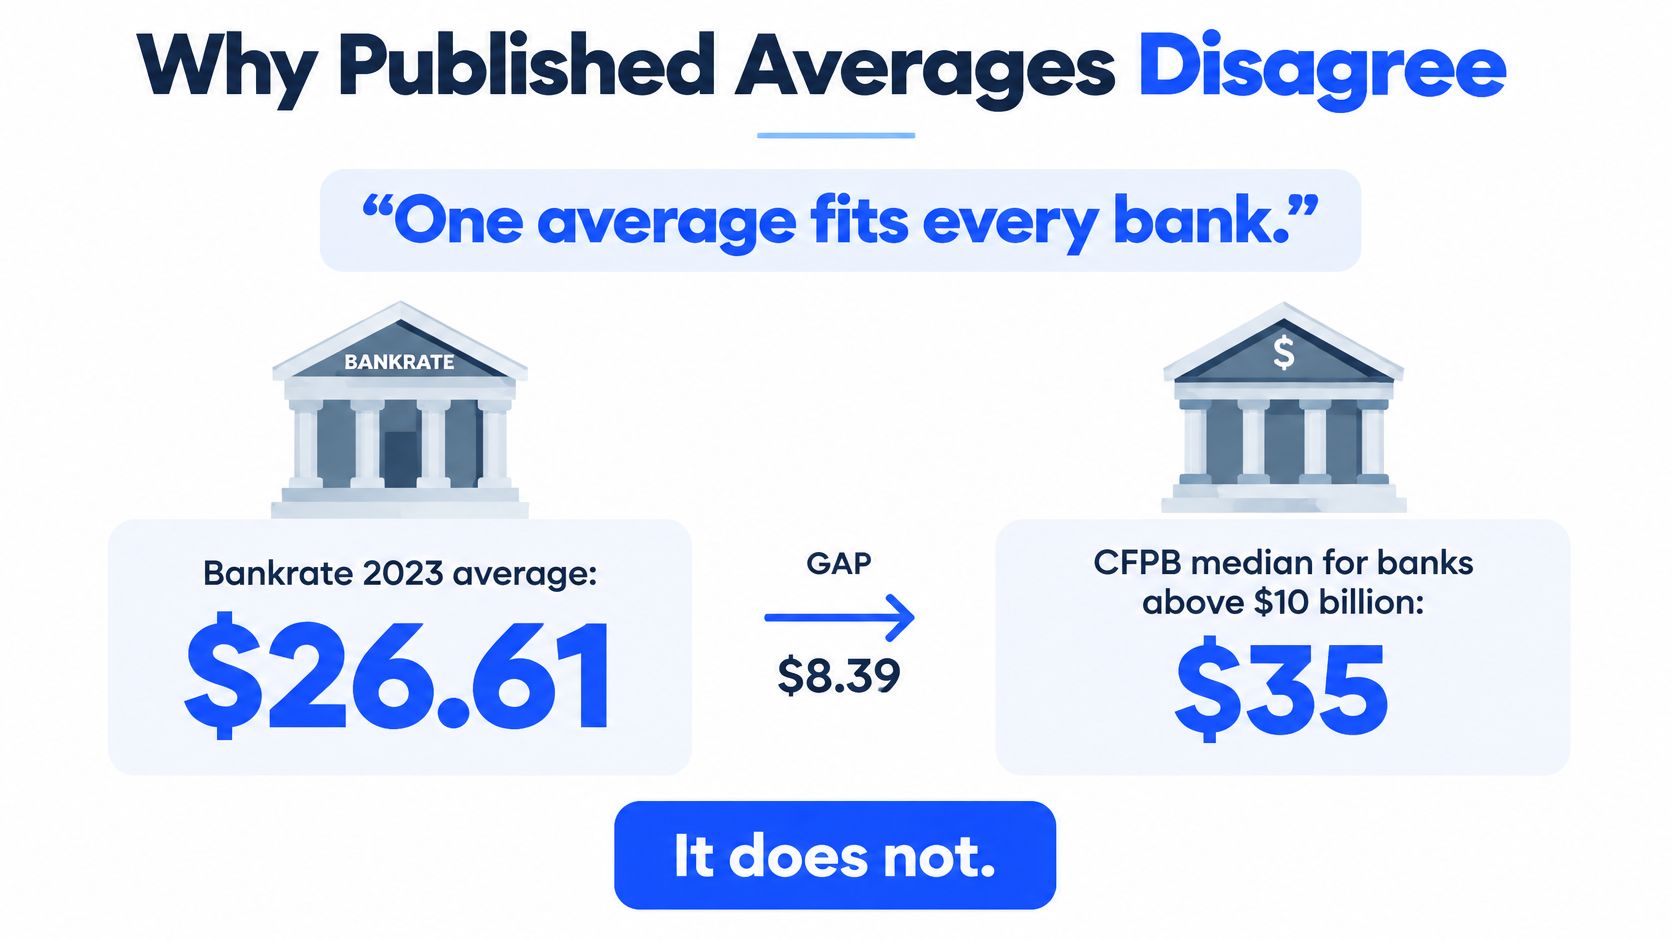
Survey and regulatory figures bracket that median on both sides. The CFPB's overdraft rule analysis cites Bankrate's 2023 checking-account survey average of $26.61 and reports a $35 median across 119 banks and credit unions holding more than $10 billion in assets between December 2022 and August 2023. Revenue per account tells a third version of the story: the National Consumer Law Center's overdraft revenue analysis shows Regions Bank averaging $30 per account in 2025, while NASCUS's summary of NCLC regulatory data puts Navy Federal Credit Union at $28 per account in 2024.
| Source | Average figure | Scope and year |
|---|---|---|
| FDIC Study of Bank Overdraft Programs | $27 median (range $10 to $38) | Automated overdraft usage fees per transaction |
| Bankrate 2023 checking-account survey | $26.61 | Average overdraft fee across surveyed checking accounts, 2023 |
| CFPB, banks and credit unions over $10 billion | $35 median | December 2022 to August 2023 |
| CFPB, five very large financial institutions | $32.50 | Fee revenue divided by fee-generating transactions |
| Regions Bank | $30 per account | Overdraft-fee revenue per account, 2025 (National Consumer Law Center) |
| Navy Federal Credit Union | $28 per account | Overdraft fees per account, 2024 (National Consumer Law Center) |
Read the third column before the second. Three different units sit in that table, and mixing them up produces nonsense comparisons:
- Per transaction rows price one event, which is what a customer pays for a single overdraft.
- Per account rows divide a bank's total fee take across every account it holds, including the many that never overdraw, so they read lower than any schedule fee.
- No row is an annual household cost. A total depends on how many times a given customer overdraws, and the published averages say nothing about that.
The working range for planning is $27 to $35 per overdraft. Accounts at banks that have cut or dropped the charge sit below it, sometimes at zero; accounts still on a traditional schedule sit at or above it.
Why Published Averages Disagree
The assumption worth testing is that one national average applies to every bank. It doesn't, and most of the spread between published numbers comes from method rather than from genuine dispute about the facts.
The CFPB's study of overdraft practices at five very large financial institutions reports an average of $32.50 per transaction, reached by dividing total overdraft-fee revenue by the number of transactions that generated a fee. That's a realized average: it reflects fees collected across five institutions, after waivers and reversals, not one bank's posted schedule. The same study found the average overdrawn amount charged off per overdraft transaction was $2.00, which is the cleanest illustration of why a flat fee can be disproportionate to the shortfall it covers.
Three measures that look alike and are not
- Posted fee. The figure printed in the account's fee schedule, before any waiver or reversal.
- Fee paid. What appears on the statement after refunds, grace periods and reversals, which is the figure per-transaction regulatory averages try to capture.
- Combined overdraft and NSF revenue. Total dollars a bank reports for both fee types, which moves with the number of charged events as well as with price. A falling total can coexist with a flat per-fee average.
Why the samples differ
A consumer survey weights whatever accounts respond, and it usually includes fee-free and reduced-fee accounts that pull the average down. An institutional median across banks above $10 billion weights the largest branch networks. A per-account revenue figure spreads one bank's fee income across every customer, overdrawers and non-overdrawers alike. None of the three is wrong; they answer different questions.
The practical habit is to check three things before quoting any figure: who published it, how it was calculated, and what period it covers. Comredix applies that same discipline through a checker that refetches every price and figure quoted and fixes or removes anything that no longer matches.
Overdraft Fee Designs and What Each Costs
Start with the design that produces the headline number: a flat charge applied each time the bank pays an item that overdraws the account. Federal Reserve joint guidance on overdraft protection programs describes the mechanisms banks commonly use. One is a flat fee every time an overdraft item is paid. Another is a daily fee for every day the account stays overdrawn, and some institutions charge both.
The same guidance puts typical overdraft limits between $100 and $500, which sets how far a balance can travel below zero before items start getting declined rather than paid. That limit, not the fee, decides how many separate items can trigger a charge on the same day.
| Fee design | How it is charged | Typical cost |
|---|---|---|
| Flat per-item fee | Each time an overdraft item is paid | $27 median; $10 to $38 range |
| Daily continuing fee | Each day the account stays overdrawn | Set per account, listed in the fee schedule |
| Daily cap | Maximum overdraft fees per day, where the bank sets one | Stated in the account disclosure, or declared absent |
Say an $18 debit-card purchase posts against a $9 balance. The bank pays it, the account drops to negative $9, and the per-item charge lands the same day. If the balance stays negative and a daily fee applies, every further day adds to the total until a deposit arrives or the cap is reached. On that basis, a bank charging a plain per-item fee can cost less over a long weekend than one charging a smaller per-item fee plus a daily charge for each negative day.
Practical rule: A lower average doesn't guarantee a lower cost, because averages rarely capture daily charges, caps or grace periods. Read the schedule, not the survey.
Overdraft Terms Defined
Seven terms cover nearly every fee question a customer brings to a bank statement.
Overdraft fee. A flat charge each time the bank pays an item that takes the account below zero. It is the figure most published averages describe.
Daily fee. A charge applied for each day the account remains overdrawn, sometimes instead of the per-item fee and sometimes alongside it. It is the line that makes a short overdraft expensive.
NSF fee. A separate charge for a payment the bank returns rather than pays for insufficient funds. It shows up on its own statement line, and reported revenue totals usually count it together with overdraft income.
Overdraft limit. The ceiling on how far below zero the account can go, set in the account agreement. It controls how many items can each generate a charge before the bank starts declining them.
Opt-in. The affirmative consent a bank must have before it can charge an overdraft fee on an ATM withdrawal or a one-time debit-card transaction. A customer who never gives it cannot be charged that fee on those transactions.
Posted fee, fee paid, combined revenue. Three different measures: the scheduled price, the amount left after refunds and reversals, and the bank's reported revenue across both fee types. They answer different questions, so a bank's headline fee and its reported revenue can diverge even when both are accurate.
Annual fee exposure. Chargeable overdrafts multiplied by the fee, plus daily fees and NSF charges. It is the term that turns a posted price into a personal cost.
How to Calculate Your Annual Overdraft Cost
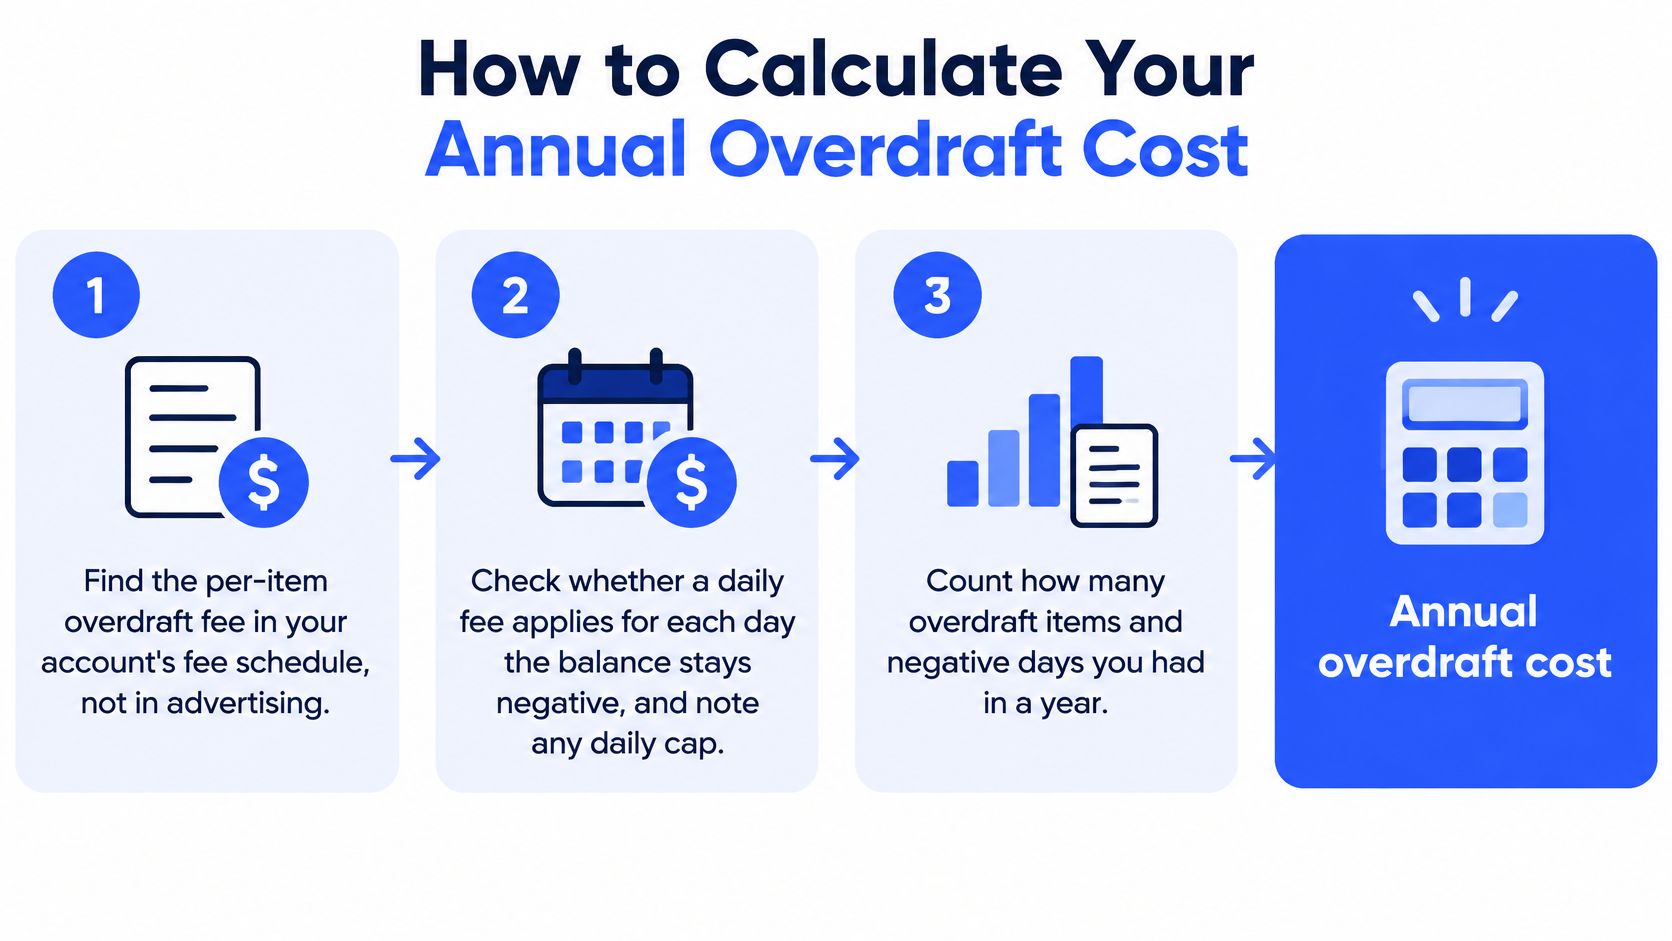
A bank's average fee and a household's actual cost are different numbers, and only one of them shows up on a statement. The seven checks below turn a schedule price into a yearly figure.
- Find the per-item fee in the fee schedule. National averages describe a market, not an account; the schedule attached to the account is what the bank will charge.
- Check for a daily fee. Look for continuous or daily negative balance charges in the same document, and note any cap on the number of fees per day.
- Count overdraft events for the last 12 months. Statements and online history usually list them on separate lines, so the count takes a few minutes.
- Count NSF returns separately. A returned payment carries its own charge at most banks and won't appear in the overdraft line.
- Multiply and add. Events times the per-item fee, plus daily charges for each negative day, plus NSF charges.
- Subtract what came back. Refunds, waived fees and anything a grace period prevented reduce the total, and banks apply them unevenly, so review each month.
- Set the total against monthly income. The comparison that matters is fee cost against cash flow, not fee cost against someone else's average.
The arithmetic on ten overdrafts
Ten chargeable overdrafts at $32.50 come to $325 before any refunds or caps, the exposure calculation a submission to the CFPB's overdraft inquiry uses to distinguish event pricing from annual burden. The purchases that trigger those fees are usually small: the 2026 overdraft fee statistics from fintech-index report that the typical debit transaction causing an overdraft is $24 or less, so a single charge can exceed the value of the purchase several times over. Importing a year of transactions into a budgeting app speeds up the count, and the Comredix comparison of budgeting apps lists options by documented features and published prices.
Where the arithmetic usually goes wrong
The most common slip is treating the advertised fee as the full cost. It leaves out daily charges, NSF returns on a second payment, and the repeat fees that accumulate when a deposit arrives late. The second slip runs the other way: counting gross fees without subtracting refunds, which many banks grant on request for a customer with no history of overdrawing.
A low result looks like this. Few charged events across twelve months, a grace period that covered the one late payment, and debit purchases small enough to decline or cover from a buffer before the balance goes negative.
Who Pays Overdraft Fees and How Often
12% of banked US adults paid an overdraft fee during 2025, according to Federal Reserve data on the economic well-being of US households. One national rate hides nearly all of the variation that decides what overdrafts cost a household.
| Group | Share who paid an overdraft fee |
|---|---|
| All banked US adults (2025) | 12% |
| Family income below $25,000 (2025) | 17% |
| Family income of at least $100,000 (2025) | 6% |
| Black adults (2025) | 25% |
| Hispanic adults (2025) | 17% |
| White adults (2025) | 8% |
| Consumers in a household charged an overdraft or NSF fee in the prior year (CFPB) | 26.5% |
The gap between the first row and the rows beneath it is the argument against reading a per-fee average as a general cost of banking. A household earning below $25,000 paid an overdraft fee at nearly three times the rate of a household earning $100,000 or more, and the racial gap runs wider: 25% of Black adults compared with 8% of White adults. The 26.5% figure in the final row measures something broader. CFPB research cited in the same Federal Reserve report counted any consumer living in a household charged an overdraft or NSF fee during the prior year, so it picks up returned payments as well as paid overdrafts and reaches every adult in a household where a charge landed. That makes it the better guide to how far fee exposure spreads.
What recurrence costs a household
A published incidence rate records whether any fee was paid in the year, not how many. What decides the annual bill is recurrence (the count of charged events in twelve months), share of cash flow (what those charges take out of monthly income), and the terms of the alternative (whether a fee-free account imposes a monthly charge or narrows what the account covers).
The last two explain the table. The same dollar fee consumes a bigger share of a below-$25,000 budget, so identical fee counts cost a lower-income household more of its income. And because the cheapness of any alternative depends on the account's own terms, the right comparison is total account cost rather than the overdraft fee alone.
American consumers broadly view overdraft fees as unfair, and banks and industry polling still argue the coverage has value as a short-term liquidity option. Both claims can be true at once.
That tension is why the coverage decision deserves a cost comparison rather than a blanket warning. Opting in, opting out, linked-account transfers, declined payments and small-dollar credit each carry a different price, and the cheapest option flips with how often a household runs short.
Your Rights Before You Opt In
Regulation E requires affirmative consumer consent before a bank can charge an overdraft fee for an ATM withdrawal or a one-time debit-card transaction. Without that consent, the transaction gets declined rather than paid, and no overdraft fee attaches to it.
The bank must supply written or electronic disclosures describing the service. Those disclosures carry the details a customer needs to price the risk:
- The applicable fees. The per-item charge, and any daily charge, stated rather than implied.
- The maximum fee where relevant. A ceiling, where the bank sets one.
- The maximum number of fees per day. Or an explicit statement that no daily limit applies, which is the answer that should prompt a second look.
- The service description. What the coverage does and doesn't pay.
The opt-in rule doesn't cover every transaction type. Checks and recurring electronic payments can follow different bank policies, which matters most for customers whose shortfalls come from scheduled bills rather than card purchases.
Verify four things before consenting: pull the disclosure from account documents or online banking, note the per-item fee and the daily maximum, ask how recurring payments are treated, and keep a written record of any later change to the opt-in status. A customer can decline coverage for ATM and one-time debit transactions, and the daily maximum is the number that caps annual exposure, because it limits how many charges a single bad day can produce.
Lower-Cost Options Compared
Five routes cover most of what a customer can choose between, and each trades one cost for another.
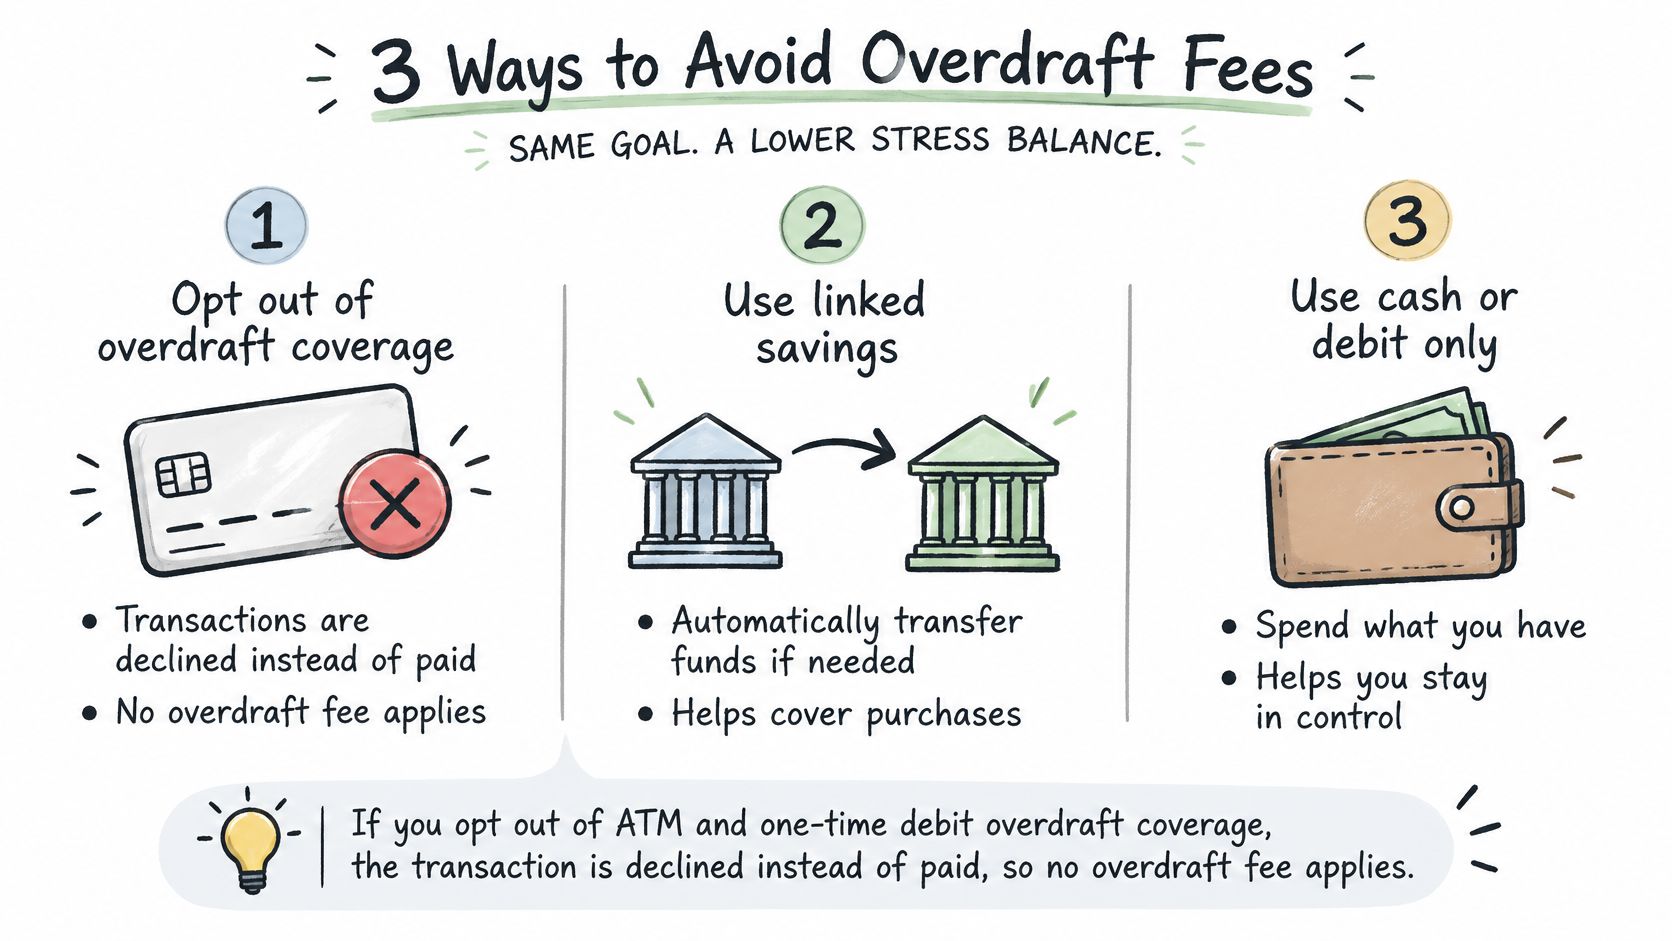
- Decline the coverage for ATM and one-time debit items. The transaction is refused instead of paid, so no overdraft fee applies. The trade-off is a failed purchase at the counter.
- Link a savings account for automatic transfers. The shortfall gets covered without an overdraft charge, but many banks levy their own transfer fee, and the savings balance has to be large enough to matter. The Comredix ranking of savings accounts compares posted rates and minimum deposits if the buffer needs building first.
- Choose a checking account that doesn't charge for overdrafts. Some banks have dropped the fee or replaced it with a small no-charge buffer. The cost often reappears as a monthly account fee or a narrower set of features, so compare the annual total rather than the headline.
- Accept a returned payment. This avoids the overdraft charge but can trigger an NSF fee at the bank and a late charge from the biller, which is usually the more expensive outcome.
- Use small-dollar credit or an overdraft line of credit. Sensible for a single larger shortfall, at an interest cost that can run higher than one flat fee if the balance lingers.
Banks and industry polling argue that overdraft protection has real value as short-term liquidity, and for a household facing an unavoidable payment that's a fair point. The choice turns on frequency: a customer who overdraws once a year is buying insurance, while one who overdraws monthly is paying a recurring charge.
The decision rule is simple enough. Rare shortfalls favor opting out and keeping a buffer. Recurring shortfalls favor running the twelve-month total from the calculation and comparing it against the annual cost of a fee-free account, a linked transfer habit, or a small line of credit. The number decides, not the label on the account.
Check Your Overdraft Fee Before You Opt In
- Open the current fee schedule. Note the per-item fee, any daily fee and any cap, straight from the bank's own document.
- Place it against the benchmark range of $27 to $35. Record whether the account sits above, inside or below that band.
- Run the annual calculation on the last 12 months of statements. Twelve months, not one, because overdrafts cluster around specific events like a job change or a car repair.
- Review the opt-in status for ATM and one-time debit coverage. Keep it, change it or decline it, and record the decision.
- Compare the annual total with the alternatives. A high-interest checking account with a small monthly yield may offset a fee that a budget account avoids, and the Comredix ranking of high-interest checking accounts sets out posted rates and minimums for that comparison.
Repeat the check once a year. Bank policies change, published averages move, and an account that priced well two years ago can sit above the market now without notifying anyone.
Comredix publishes sourced figures rather than a single national average, so a fee schedule can be checked against the benchmark instead of taken on trust. Its personal finance section covers checking accounts, savings rates and budgeting tools side by side, with every statistic linked to the organization that published it. Visit Comredix before the next fee change appears on a statement.
Spotted an error in this guide? Email editorial@comredix.com